
Analysis: With the arrival of 122 TB SSDs, the case for disk drives being replaced by SSDs suddenly looks much more compelling.
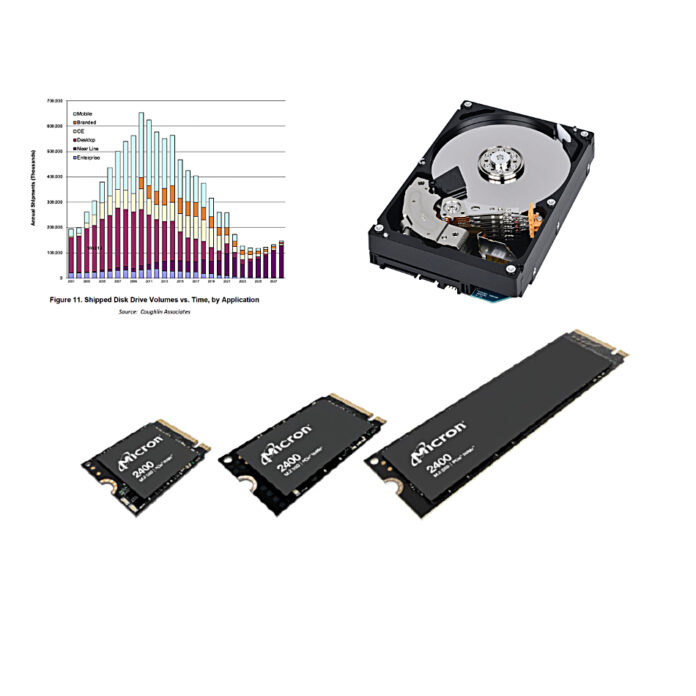
At the end of 2024, we have five suppliers with 60 TB-plus SSDs and three with 122 TB SSDs announced: Micron, Phison, and SK hynix. Samsung has a 60 TB-plus SSD, while Kioxia and Western Digital languish behind this 60 TB-plus pack. How does this affect the argument that HDDs will not be replaced by SSDs?
This discussion is focused on prices, performance, datacenter rack numbers, and electricity usage. We can’t examine drive acquisition prices as the ones used for volume purchases by storage array OEMs and hyperscalers are not public. However, we can understand some cost indicators that affect drive ownership. To start, we compared a 2RU x 12-slot disk drive chassis with a 2RU x 24-slot SSD enclosure from Supermicro in terms of capacity and performance:
Capacity
- 2RU HDD array – 12 x 32 TB SMR drives = 384 TB
- 2RU SSD array – 24 x 122 TB drives = 2,928 TB + 3:1 dedupe = 8,784 TB
- 40U rack with 19 x 2RU HDD enclosures = 7,296 TB – 7.3 PB
- 40U rack with 19 x 2RU SSD enclosures = 166,896 TB – 166.9 PB – 22.8 times more than an HDD rack
Note that 250 TB SSDs are coming, which will double SSD rack capacity density.
Performance
- 32 TB HDD latency: 4.16 ms
- 32 TB HDD sustained transfer rate: 269 MBps
- 122 TB SSD latency: 30 μs
- 122 TB SSD sequential read bandwidth: 14,600 MBps with PCIe gen 5 – 54.3x faster than HDD
On this basis, a 40U rack with 19 x 2RU SSD chassis containing 122 TB SSDs can replace 23 racks filled with 32 TB disk drives and deliver 54 times more read bandwidth. Imagine the datacenter space, cooling, and electricity savings from that coupled with the 50x greater performance increase over disk drive racks.
Power draw
The power draw of the individual hard drives and SSDs can be assessed using a Solidigm-Signal65 study, which looked at building a 100 MW AI datacenter using 122.88 TB QLC Solidigm SSDs, TLC SSDs, or hybrid TLC SSDs plus 24 TB HDDs deployment options, using 1, 5, and 10 PB total capacity choices.
It used a 90 percent read/10 percent write average power draw of 14.3 W for 122.88 TB Solidigm QLC SSDs with a 5 W idle rating, and 8.2 W active power and 6.5 W idle power for 24 TB disk drives. The report computed “the total power requirement associated with each drive type was calculated by taking a weighted average of the drive’s active and idle power consumption,” using calculated duty cycles.
It says “a duty cycle calculation was used, based on the performance and density of each drive. Due to the time it takes for HDDs to transition from idle to active, and the high throughput requirements of the workload, it was assumed that the HDDs, and therefore their associated SSD caching layer, were active 100 percent of the time.”
The report – we should caveat this by saying it’s from an SSD vendor – found that “the power efficiency advantage of QLC grows as the capacity increases. Compared to TLC, QLC was found to provide a power efficiency advantage between 3.3 percent to 19.5 percent as the capacity increased from 1 PB to 10 PB. Compared to the Hybrid HDD environment, the advantage was even larger, ranging from 32.9 percent at the low capacity level, to 79.5 percent at the high capacity level.”
Source: https://blocksandfiles.com/2024/12/20/the-future-of-the-hdd-is-the-ssd/


