Want to see data come to life? Explore data visualization examples that turn abstract numbers into visual stories.
Data visualization is a method of communicating complex data and information in a straightforward and aesthetically pleasing manner using graphics. It plays a pivotal role in decision-making by turning hard-to-understand datasets into visually comprehensible representations. By presenting information graphically, data visualization streamlines the identification of trends, patterns, and correlations that might otherwise remain hidden within your data.
There are many different examples of data visualizations that can be used to meet specific purposes or to suit varied datasets and analysis goals. These data visualization examples can be categorized into two major criteria: standard data visualization examples and creative data visualization examples. Becoming familiar with the different types of data visualization can help you choose the ones best-suited to your enterprise needs and objectives.
Standard Data Visualization Examples
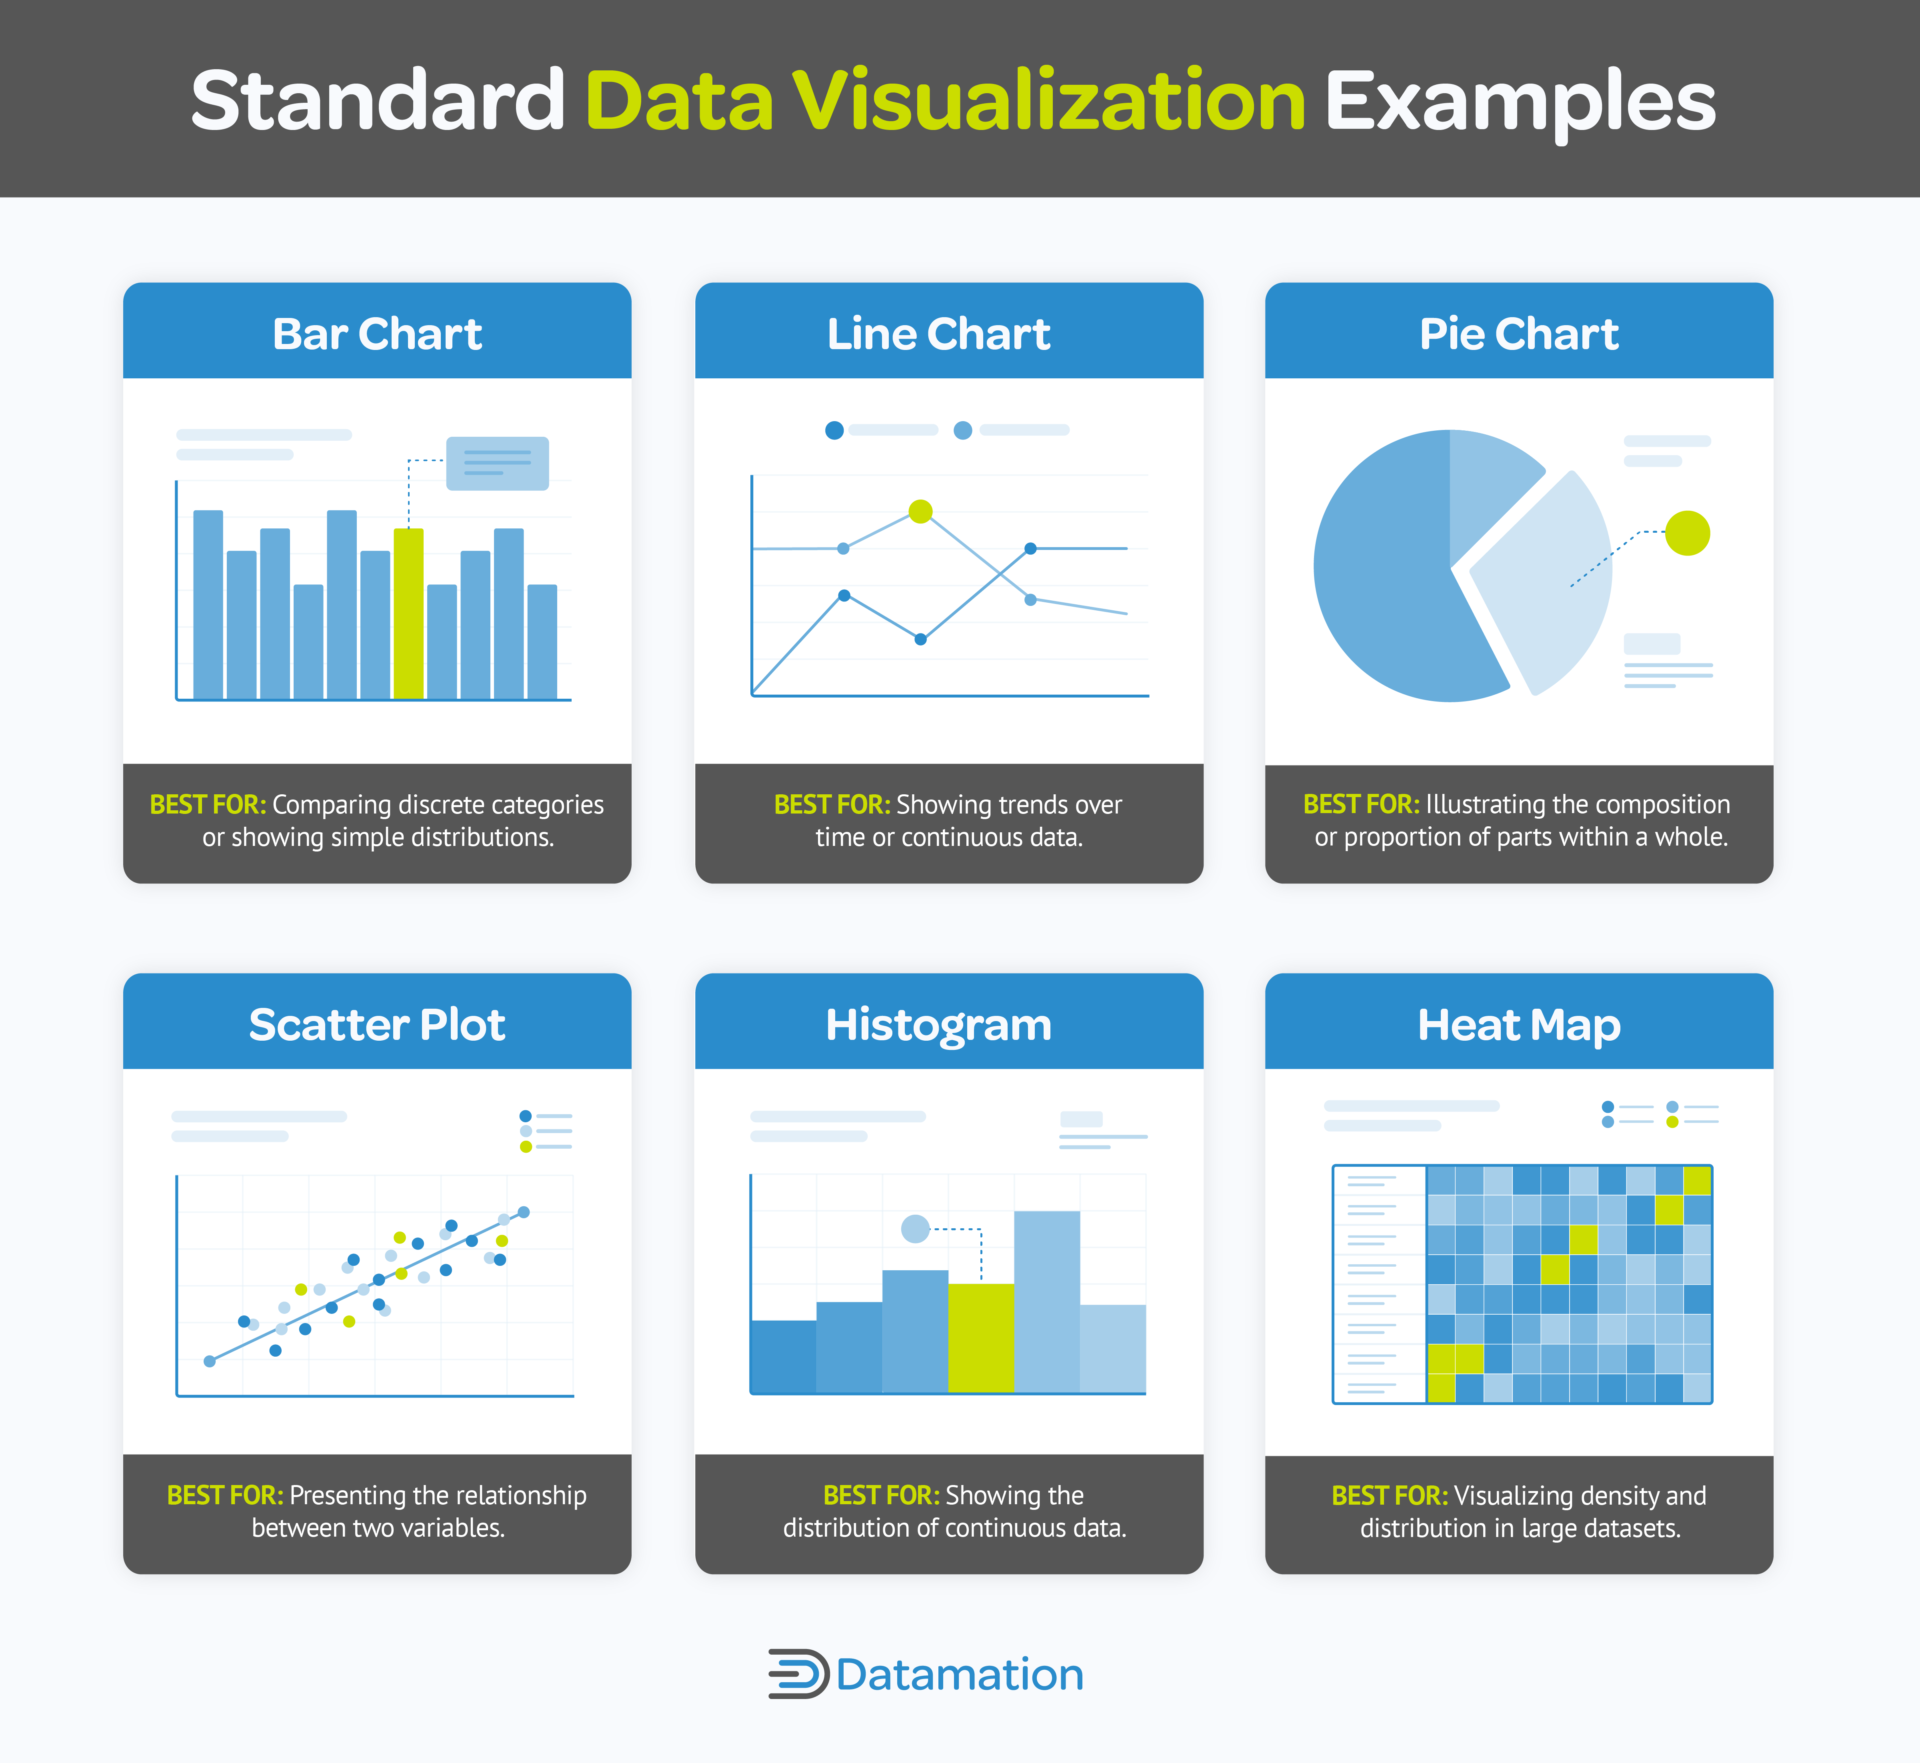
Standard data visualizations—those most commonly used in reports, presentations, and dashboards—are foundational tools for communicating data insights. The following examples of standard data visualization are some of the most popular across a wide range of industries:
Explore IT Tech News for the latest advancements in Information Technology & insightful updates from industry experts!
Source: https://www.datamation.com/big-data/data-visualization-use-cases/


